| Home | Documentation | Download | Instructions | Contact |
|
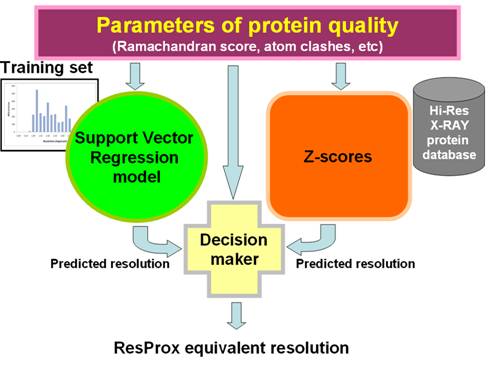
Figure 1. An outline of the ResProx algorithm. ResProx starts by assessing
multiple parameters of protein quality using sub-programs such as VADAR (Willard et al. 2003), MolProbity (Chen et al. 2010), RosettaHoles (Sheffler
and Baker 2009) and PROSESS (Berjanskii et al. 2010). The resulting quality scores are used to predict equivalent resolution
with a support vector regression model, which was trained on a set of
high-quality X-ray structures. Additionally, mean values and standard
deviations of the quality parameters for a database of high-resolution
structures are used to generate Z-scores, which are consequently converted to
equivalent resolution value via a Z-Mean protocol. Finally, a decision making
module selects one of the two equivalent resolution values as the final result,
based on the difference between the predicted values and raw scores of protein
quality.
Figure 2. Correlation between ResProx equivalent resolution and X-ray
experimental resolution for the ResProx training and testing sets. A) Final ResProx values for the
ResProx training set. B) Final ResProx values for the ResProx testing set. C)
Z-Mean equivalent resolution for the ResProx training set. D) Z-Mean equivalent
resolution for the ResProx testing set. E) SVR predictions for the ResProx
training set. F) SVR predictions for the ResProx testing set. R and Err
parameters indicate Pearson correlation coefficient and absolute mean error of
resolution prediction, respectively.
Figure 3. Correlation between equivalent resolution and
X-ray experimental resolution as calculated by Procheck-NMR, MolProbity, and
RosettaHoles2. (A) Procheck-NMR equivalent resolution for the ResProx training
set. (B) Procheck-NMR equivalent resolution for the ResProx testing set. (C) RosettaHoles2
SRESL equivalent resolution for the ResProx training set. (D) RosettaHoles2
SRESL for the ResProx testing set. (E) MolProbity score for the ResProx
training set. (F) MolProbity score for the ResProx
testing set. R and Err parameters indicate Pearson correlation coefficient and
absolute mean error of resolution prediction, respectively.
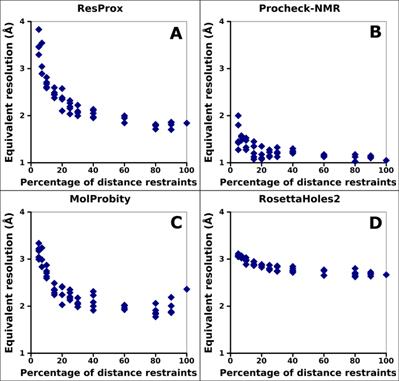
Figure 4. Correlation between completeness of
experimental information (distance restraints) and equivalent resolution of
ubiquitin. (A) ResProx score. (B) Procheck-NMR equivalent resolution. (C) RosettaHoles2
SRESL. (D) MolProbity score. Different measures of the completeness
of the distance restraints was achieved by randomly removing 5 distance
restraints from the total restraint set. Distance restraints consisted of
NOE-based distance restraints and hydrogen bond distance restraints of the
ubiquitin NMR ensemble 1D3Z.
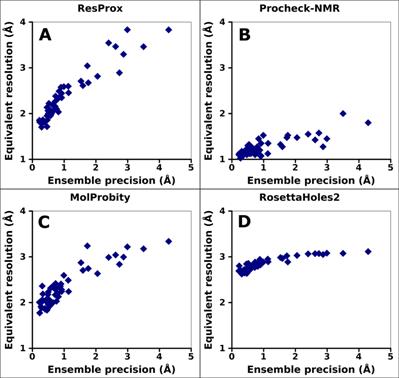
Figure 5. Correlation between equivalent resolution and the ensemble
precision
of ubiquitin. (A) ResProx score. (B) Procheck-NMR equivalent resolution. (C) RosettaHoles2
SRESL. (D) MolProbity score. Ensemble precision was assessed by
calculating backbone RMSD of ubiquitin NMR ensembles with MolMol
(Koradi et al.
1996). Spearman rank-order correlation
coefficient is 0.95, 0.69, 0.84, and 0.90 for ResProx, Procheck-NMR, MolProbity,
and RosettaHoles2, respectively.
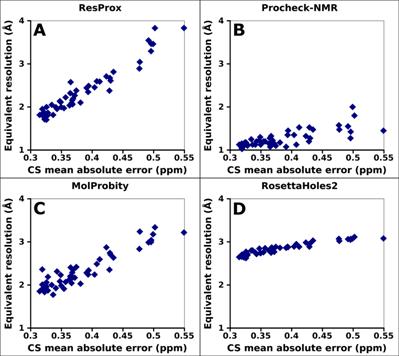
Figure 6. Correlation of equivalent
resolution with backbone proton chemical shifts (A) ResProx score. (B)
Procheck-NMR equivalent resolution. (C) RosettaHoles2 SRESL. (D)
MolProbity score. The agreement between ubiquitin models and backbone proton
chemical shifts was assessed by predicting the chemical shifts from different NMR
models with ShiftX2 (Han et al. 2011) and calculating the mean
absolute difference between predicted and experimentally measured chemical
shifts. Spearman rank-order correlation coefficient is 0.95, 0.73, 0.85, and
0.95 for ResProx, Procheck-NMR, MolProbity, and RosettaHoles2, respectively.
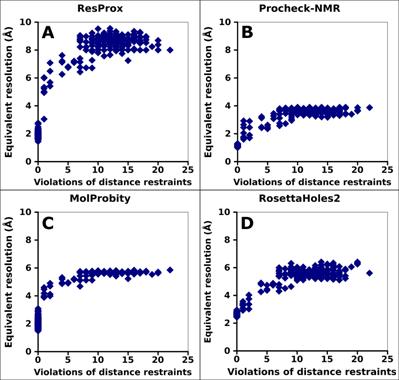
Figure 7. Correlation between equivalent resolution
of ubiquitin and the number of distance violations. (A) ResProx score (B)
Procheck-NMR equivalent resolution. (C) RosettaHoles2 SRESL. (D)
MolProbity score.
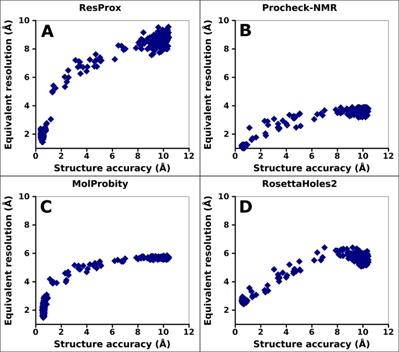
Figure 8. Correlation between the equivalent
resolution of ubiquitin and model accuracy. (A) ResProx resolution
(B) Procheck-NMR equivalent resolution. (C) RosettaHoles2 SRESL.
(D) MolProbity score. Model accuracy was measured by calculating backbone RMSD
of ubiquitin models with respect to the ubiquitin X-ray structure 1UBQ. NMR
models of ubiquitin with different distance restraint violations were analyzed
(see text for details).
Table 1.
Correlation coefficients and mean absolute errors of
ResProx, Procheck-NMR, MolProbity, and RosettaHoles2 for obsolete and current
PDB entries of NMR structures..
Table 2. Improvements in the quality of water refined
models - Comparison between ResProx values and DRESS Z-scores.
Table 3.
Structure quality parameters used in
the calculation of ResProx's equivalent resolution.
1 - Coefficient of correlation between the
score and X-ray resolution for ResProx training set. 2 - This column specifies whether scores
were used in its logarithm form ("Yes") or not ("No"). Star (*)
indicates the scores, whose logarithm was taken 16 times. 3,4 -
Lower and upper bounds indicate the minimal and the maximal values, respectively,
that scores were allowed to have in ResProx calculations. 5 - This column specifies whether a score Z-value
was used for Z-Mean calculations and, if so, what score Z-value were
considered: only positive, only negative, or both positive and negative (see
text for more details). 6 - More
information about scores can be found in corresponding publications and/or on
websites of RosettaHoles (Sheffler and Baker 2009), PROSESS (Berjanskii et al. 2010), GeNMR(Berjanskii et al. 2009), and MolProbity (Chen et al. 2010; Davis et
al. 2007). 7 - The
percentages of bad bond lengths and bad bond angles are used only when their
values exceed 4 standard deviatio Figure 9.
Resolution histogram of ResProx training/testing set. Proteins were
grouped in 0.25Å bins. At
least, 100 structures per resolution bin were placed in each bin, spanning the
range between 1.0 Å and 3.75 Å.
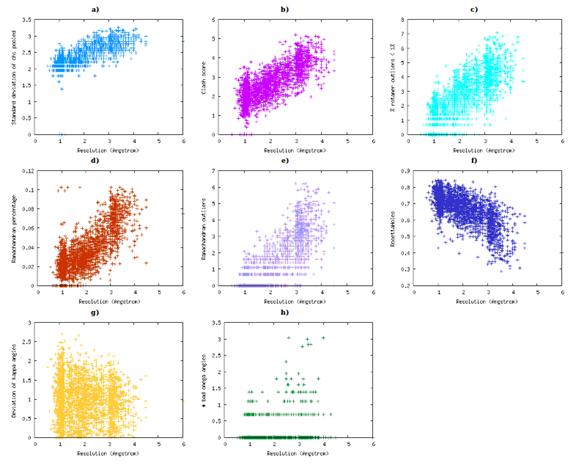
Figure 10.
Relationship between X-ray resolution and several ResProx protein quality
scores for the ResProx training set. (A) Standard deviation of
χ1 pooled from VADAR. (B) Clash Score from MolProbity; (C) Percent of
<1% side-chain rotamer outliers from MolProbity.(D) RAMA score from GeNMR. (E) Ramachandran outliers from MolProbity. (F)
RosettaHoles score. (G) Deviation of Kappa angles from PROSESS. (H) Percentage
of disallowed Ω angles from VADAR.
Figure 11.
Curve-fitting of a plot of X-ray resolution vs. average
absolute Z score. Only the linear part of the plot, spanning the
range of mean absolute Z-scores from 0 to 1.2 was used for curve-fitting. The
curve-fitting was done with QtiPlot (Vasilief 2011).
Figure 12.
GeNMR-based threshold for detecting poor-quality protein
structures. The total GeNMR knowledge-based score, excluding radius
of gyration score, is shown with blue diamonds for 50000 protein structures
from the PDB. The solid line indicates selected threshold that separates 99.9%
of the structures from a few poor-quality outliers.
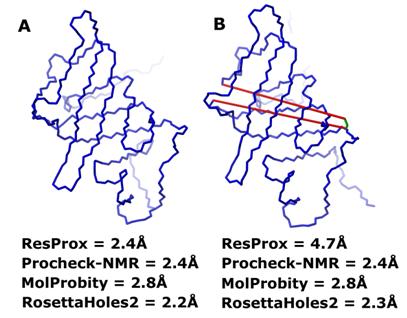
Figure 13. Equivalent resolution of "intact" and "broken" models of
obsolete NMR ensemble of the E. coli heme chaperone CcmE, 1LIZ. (A) "Intact" model 1 of 1LIZ. (B)
"Broken" model 3 of 1LIZ. The misplaced Glu105 residue is colored
green. Vectors of broken bonds between Glu105 and adjacent residues are shown
with red lines. The figure was generated using MolMol (Koradi et al.
1996).
Figure 14. Histogram
of ResProx equivalent
resolution for NMR models and experimental resolution for X-ray structures. 500 NMR ensembles and 500 X-ray
structures were randomly selected from the PDB.
References: Berjanskii M, Liang Y, Zhou J, Tang P, Stothard
P, Zhou Y, Cruz J, MacDonell C, Lin G, Lu P, Wishart
DS (2010) PROSESS: a protein structure evaluation suite and server. Nucleic
Acids Res 38 (Web Server issue):W633-640 Berjanskii M, Tang P, Liang J, Cruz JA, Zhou J, Zhou
Y, Bassett E, MacDonell C, Lu P, Lin G, Wishart DS
(2009) GeNMR: a web server for rapid NMR-based protein structure determination.
Nucleic Acids Res 37 (Web Server issue):W670-677 Chen VB, Arendall WB, 3rd, Headd JJ, Keedy DA, Immormino RM, Kapral GJ, Murray
LW, Richardson JS, Richardson DC (2010) MolProbity: all-atom structure
validation for macromolecular crystallography. Acta Crystallogr D Biol Crystallogr 66 (Pt 1):12-21 Davis IW, Leaver-Fay A, Chen VB, Block JN, Kapral GJ, Wang X, Murray LW, Arendall
WB, 3rd, Snoeyink J, Richardson JS, Richardson DC
(2007) MolProbity: all-atom contacts and structure validation for proteins and
nucleic acids. Nucleic Acids Res 35 (Web Server issue):W375-383 Koradi R, Billeter M, Wuthrich K (1996) MOLMOL: a program for display and
analysis of macromolecular structures. J Mol Graph 14 (1):51-55, 29-32 Lovell SC, Word JM, Richardson JS, Richardson DC
(2000) The penultimate rotamer library. Proteins 40
(3):389-408 Sheffler W, Baker D (2009) RosettaHoles: rapid
assessment of protein core packing for structure prediction, refinement,
design, and validation. Protein Sci 18 (1):229-239 Vasilief I (2011) QtiPlot - Data Analysis and Scientific Visualisation. http://soft.proindependent.com/qtiplot.html, 0.9.8.4 edn., Willard L, Ranjan A, Zhang
H, Monzavi H, Boyko RF,
Sykes BD, Wishart DS (2003) VADAR: a web server for quantitative evaluation of
protein structure quality. Nucleic Acids Res 31 (13):3316-3319 |